Bike Sales Analysis in MS Excel

With provided database of customer profiles with purchase information, I wanted to explore certain correlations in order to determine what type of customer buys the most of the product.
With that in mind, I decided to compare the average income of males and female customers in relation to number of purchased bikes.
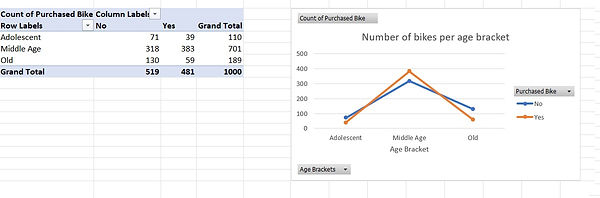
Another important question was what was their commute distance and how that influenced the number of sold bikes. And at the end, I wanted to visualize the age bracket of active customers.
For further exploration, I decided upon an interactive dashboard I made in MS Excel. The above questions can be detailed as to the region and education of customers.
The steps taken:
1. Cleaning the data set.
2. Creating pivot tables
3. Based on pivot tables, creating visual representation of data.
4. Creating dashboard.